Backtesting tutorials almost always use American stocks, and the data is
handed to you clean. Indian markets are a better teacher, precisely because
they are messier. I wrote a small Python package called indiabt to teach with
it: end-of-day bars for NSE and BSE, built from the files the exchanges post
publicly.
Most of what I learned was not about strategies at all. It was about how a backtest lies to you, and where.
Where the data comes from
Both exchanges publish a daily file of everything that traded, called a bhavcopy. The downloader fetches about one file a second, caches everything, and never asks for the same day twice. In July 2024 both exchanges moved to a new standard format (UDiFF) and dropped the old files, so the tool tries the new one first and falls back to the legacy file for earlier dates.
A few quirks I only found by looking at real files:
- BSE serves a missing file as an HTTP 200 with an HTML page. Checking the status code tells you nothing, so we check the content.
- Same-day settlement trades show up as duplicate rows, with a
#on the BSE ticker and aT0series on NSE. They have to be dropped or every price appears twice. - Old BSE files have space-padded fields and no ticker at all, only a scrip code and a name.
Companies are not their tickers
To compare a stock across both exchanges you need to know that two rows are the same company. Every row carries an ISIN, which sounds like the answer, until a stock split changes it. Nestle India got a new ISIN on its 10:1 split in January 2024, while its ticker and BSE code stayed put. Tickers get renamed, and sometimes recycled by an unrelated company.
The fix is a union-find over ISINs: two ISINs are the same security if they traded under the same symbol or scrip code and share an issuer code (characters 4 to 7 of the ISIN). A reused ticker has a different issuer, so it stays apart.
Prices must be adjusted, and nobody tells you how
If a stock splits 10:1, the raw price series falls 90% overnight, and any strategy will read that as a crash. So prices are back-adjusted: today's prices are real, older ones are scaled so nothing jumps. Corrections come from three sources, most trusted first: your own CSV of fixes, the NSE corporate actions feed, and inference from clean split-ratio gaps.
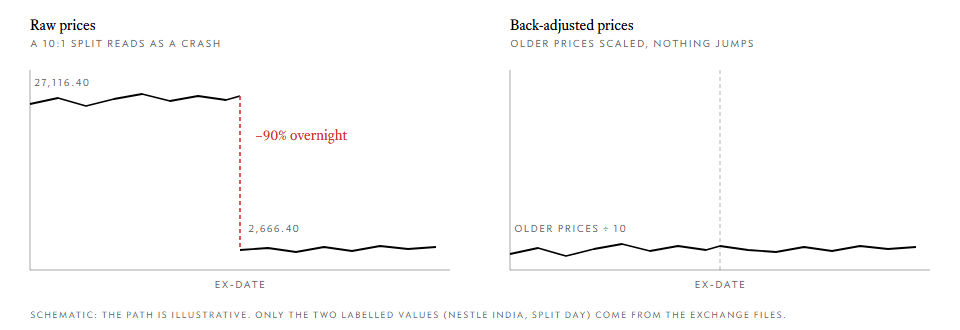
One thing surprised me. Neither exchange adjusts "previous close" on the ex-date, so you cannot find actions by comparing it. On Nestle's split day both exchanges show a previous close of 27,116.40 next to a close of 2,666.40.
The tool is honest about what it cannot adjust. Rights issues, demergers and buybacks are reported but not corrected, and any overnight move above 30% that remains is flagged as unexplained, with the date, so you can check whether it was news or a missing action.
Costs are where fiction hides
The engine itemises every charge: brokerage, STT, exchange fees, the SEBI turnover fee, GST, stamp duty, the depository charge on sells, and slippage. The one that caught me out is BSE's exchange fee, which depends on the scrip group of the day. An A-group stock pays Rs 375 per crore of turnover. An X-group small cap pays Rs 10,000 per crore, about 27 times more.
BSE_TXN_BY_GROUP = {
    **{g: 375 / CRORE for g in ("A", "B", "T", "P", "E", "F", "G", "W")},
    **{g: 10_000 / CRORE for g in ("X", "XT", "Z", "ZP", "XC", "XD")},
}
Backtest a BSE small cap at the A-group rate and your results are fiction.
No lookahead, on purpose
The engine is bar by bar and long only. A signal is computed on day t's close, and the order fills at day t+1's open, plus slippage. It sounds obvious, and it is the first thing beginner backtests get wrong.
Writing a strategy is meant to be easy to read. You list your parameters and write three methods:
class GoldenCross(Strategy):
    params = dict(fast=50, slow=200)

    def setup(self, d):
        d["fast"] = sma(d.close, self.p.fast)
        d["slow"] = sma(d.close, self.p.slow)

    def entry(self, d):
        return crossover(d.fast, d.slow)

    def exit(self, d):
        return crossunder(d.fast, d.slow)
Then one command produces a self-contained HTML report, with no JavaScript libraries and no CDNs:
python -m indiabt run examples/ma_crossover.py --symbol INFY --compare
The --compare flag runs the same strategy on NSE and on BSE side by side,
which shows how much the costs and the gaps in a thinner market change the
answer.
If you teach, the real value is not a winning strategy. It is a student seeing a 10:1 split wreck a moving average, and understanding why.
This is an education project. Nothing here is investment advice, and a backtest is a simulation that routinely looks better than live trading.
The data belongs to the exchanges. The repo ships none of it, and the tool is for downloading public files for your own study. Do not republish or resell them, and get a proper licence if you want to build anything commercial.